Skip to content

production

Beyond Basic RAG: What You Need to Know

The Real World of RAG Systems

πŸ“’ Picture this: You're a developer who just deployed your first RAG system. Everything seems perfect in testing. Then reality hits - users start complaining about irrelevant results, not being able to do "basic stuff" and occasional hallucinations. Welcome to the world of real-world RAG systems.

The Problem With "Naive RAG"

Let's start with a truth bomb: dumping documents into a vector database and hoping for the best is like trying to build a search engine with just a dictionary - technically possible, but practically useless.

Here's why:

  1. The Embedding Trap: Think embedding similarity is enough? Here's a fun fact - in many embedding models, "yes" and "no" have a similarity of 0.8-0.9. Imagine asking for "yes" and getting a "no" instead in a legal search πŸ˜…

  2. The Context Confusion: Large Language Models (LLMs) get surprisingly confused when you give them unrelated information. They're like that friend who can't ignore a app notification while telling a story - everything gets mixed up.

  3. Length Effect: Just like humans tend to get worse at noticing details the longer a story is, LLMs with large context windows get worse at noticing details the longer the information is.

The Three Pillars of Production RAG

1. Query Understanding 🎯

The first step to better RAG isn't about better embeddings - it's about understanding what your users are actually asking for. Here's the basics:

  • Query Classification: Before rushing to retrieve documents, classify the query type. Is it a simple lookup? A comparison? An aggregation? Each needs different handling.
    • NIT: Navigational, Informational, Transactional are the 3 very broad types.
  • Metadata Extraction: Time ranges, entities, filters - extract these before retrieval. Think of it as giving your students sample questions to help them pay attention to what's important in the exam (at query time) much better and faster.

Metadata Queries

The CEO of a company asks for "last year's revenue"

The CFO asks for "revenue from last year"

The CMO asks for "revenue from the last fiscal year"

Do all these queries mean different things? Not really. The asker role i.e. query metadata changes the query intent.

2. Intelligent Retrieval Strategies πŸ”

Here's where most systems fall short. Instead of one-size-fits-all retrieval:

  • Hybrid Search: Combine dense (embedding) and sparse (keyword) retrieval. You can rerank using late interaction, use LLM as a reranker or even use both in a cascade. I can probably write a whole blog post on this, but tl;dr is that you can use a combination of many retrieval strategies to get the best of precision, recall, cost and latency.
  • Query Expansion: Don't just search for what users ask - search for what they mean. Example: "Q4 results" should also look for "fourth quarter performance."
  • Context-Aware Filtering: Use metadata to filter before semantic search. If someone asks for "last week's reports," don't rely on embeddings to figure out the time range.

3. Result Synthesis and Validation βœ…

The final piece is making sure your responses are accurate and useful:

  • Cross-Validation: For critical information (dates, numbers, facts), validate across multiple sources at ingestion time. It's possible that your ingestion pipeline is flawed and you don't know it.
  • Readability Checks: Use tools like the Flesch-Kincaid score to ensure responses match your user's expertise level.
  • Hallucination Detection: Implement systematic checks for information that isn't grounded in your retrieved documents. Considering evaluating the pipeline using offline tools like Ragas

Real-World Example: The Leave Policy Fiasco

Here's a real story that illustrates why naive RAG fails:

The Leave Policy Fiasco

Company X implemented a RAG system for HR queries. When employees asked about leave policies, the system kept used the entire company's wiki -- including that of the sales team. And sales "ranked" higher because it contained similar keywords.

The result? The entire company was getting sales team vacation policies instead of their own πŸ€¦β€β™‚οΈ

The solution? They implemented:

  1. Role-based filtering

  2. Document source validation

  3. Query intent classification

Making Your RAG System Production-Ready

Here's your action plan:

  1. Query Understanding: Implement basic query type classification
  2. Ingestion: Extract key metadata (dates, entities, filters)
  3. Retrieval: Begin with metadata filtering
  4. Retrieval: Add keyword-based search or BM25
  5. Retrieval: Top it off with semantic search
  6. Synthesis: Combine results intelligently using a good re-ranker or fusion e.g. RRF
  7. Validation: Cross-check extracted dates and numbers
  8. Validation: Implement a RAG metrics system e.g. Ragas
  9. Validation: Monitor user feedback e.g. using A/B tests and adapt

Reciprocal Rank Fusion

Reciprocal Rank Fusion (RRF) is a technique that combines the results of multiple retrieval systems. It's a powerful way to improve the quality of your search results by leveraging the strengths of different retrieval methods.

But it's NOT a silver bullet.

The Challenge

Stop thinking about RAG as just "retrieve and generate."

Start thinking about it as a complex system that needs to understand, retrieve, validate, and synthesize information intelligently.

Your homework: Take one query type that's failing in your system. Implement query classification and targeted retrieval for just that type. Measure the improvement. You'll be amazed at the difference this focused approach makes.


Remember: The goal isn't to build a perfect RAG system (that doesn't exist). The goal is to build a RAG system that improves continuously and fails gracefully.

Your Turn

What's your biggest RAG challenge? Let's solve it together. Let me know on Twitter or email.

pgvector vs Qdrant- Results from the 1M OpenAI Benchmark

You may have considered using PostgreSQL's pgvector extension for vector similarity search. There are good reasons why this option is strictly inferior to dedicated vector search engines, such as Qdrant.

We ran both benchmarks using the ann-benchmarks solely dedicated to processing vector data. The difference in performance is quite staggering.

Query Speed

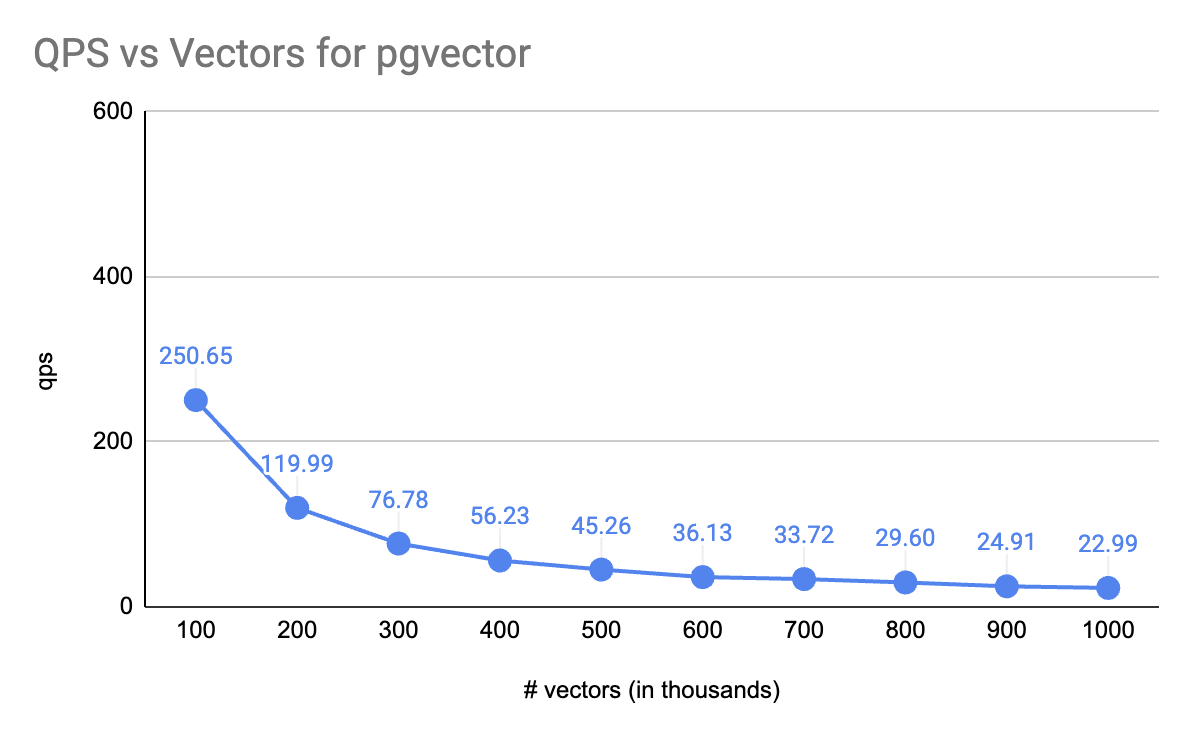
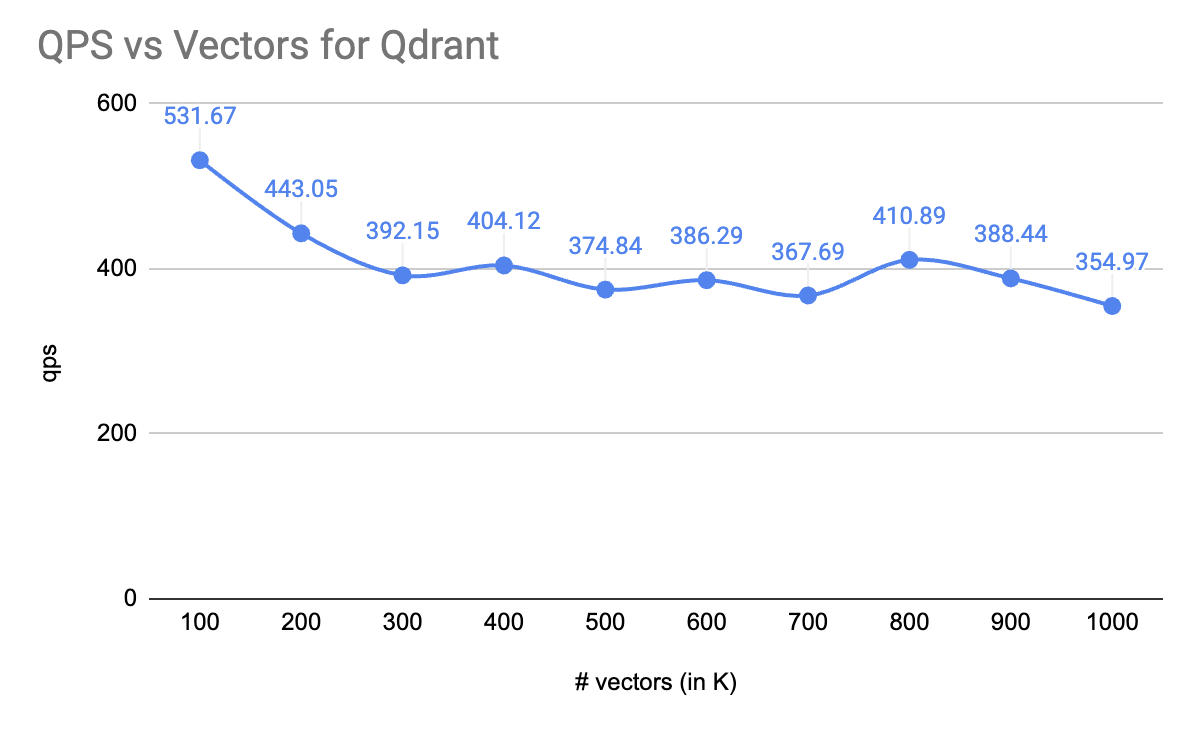
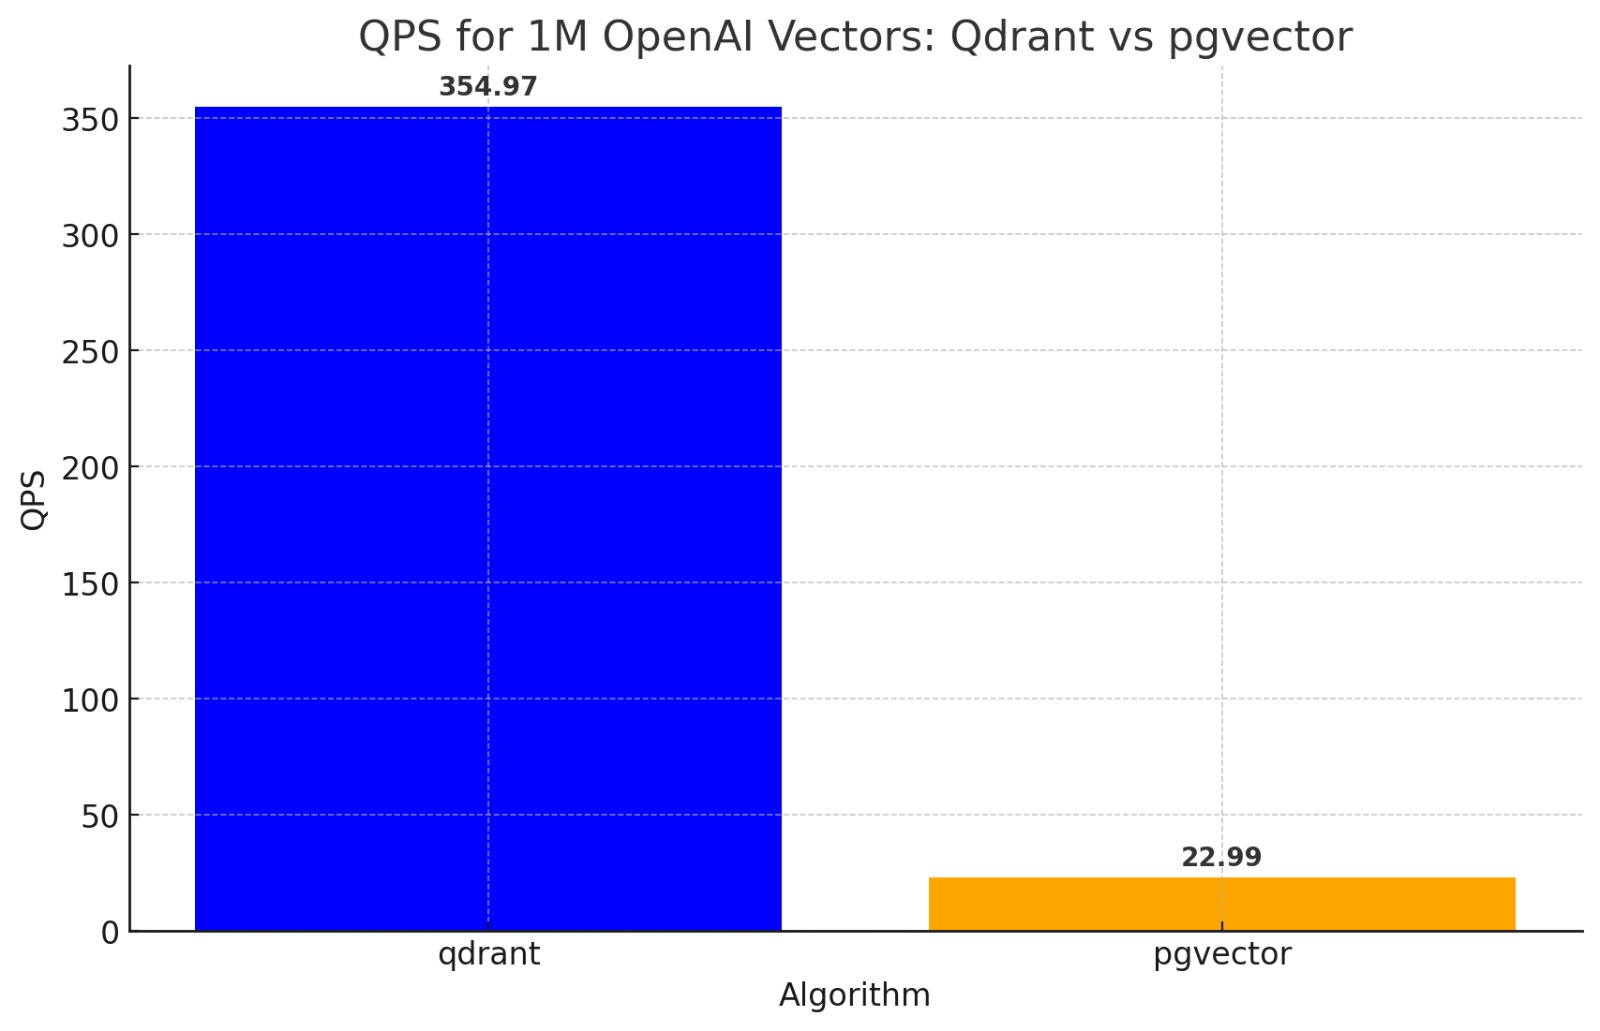
Final results show that pgvector lags behind Qdrant by a factor of 15 when it comes to throughput.

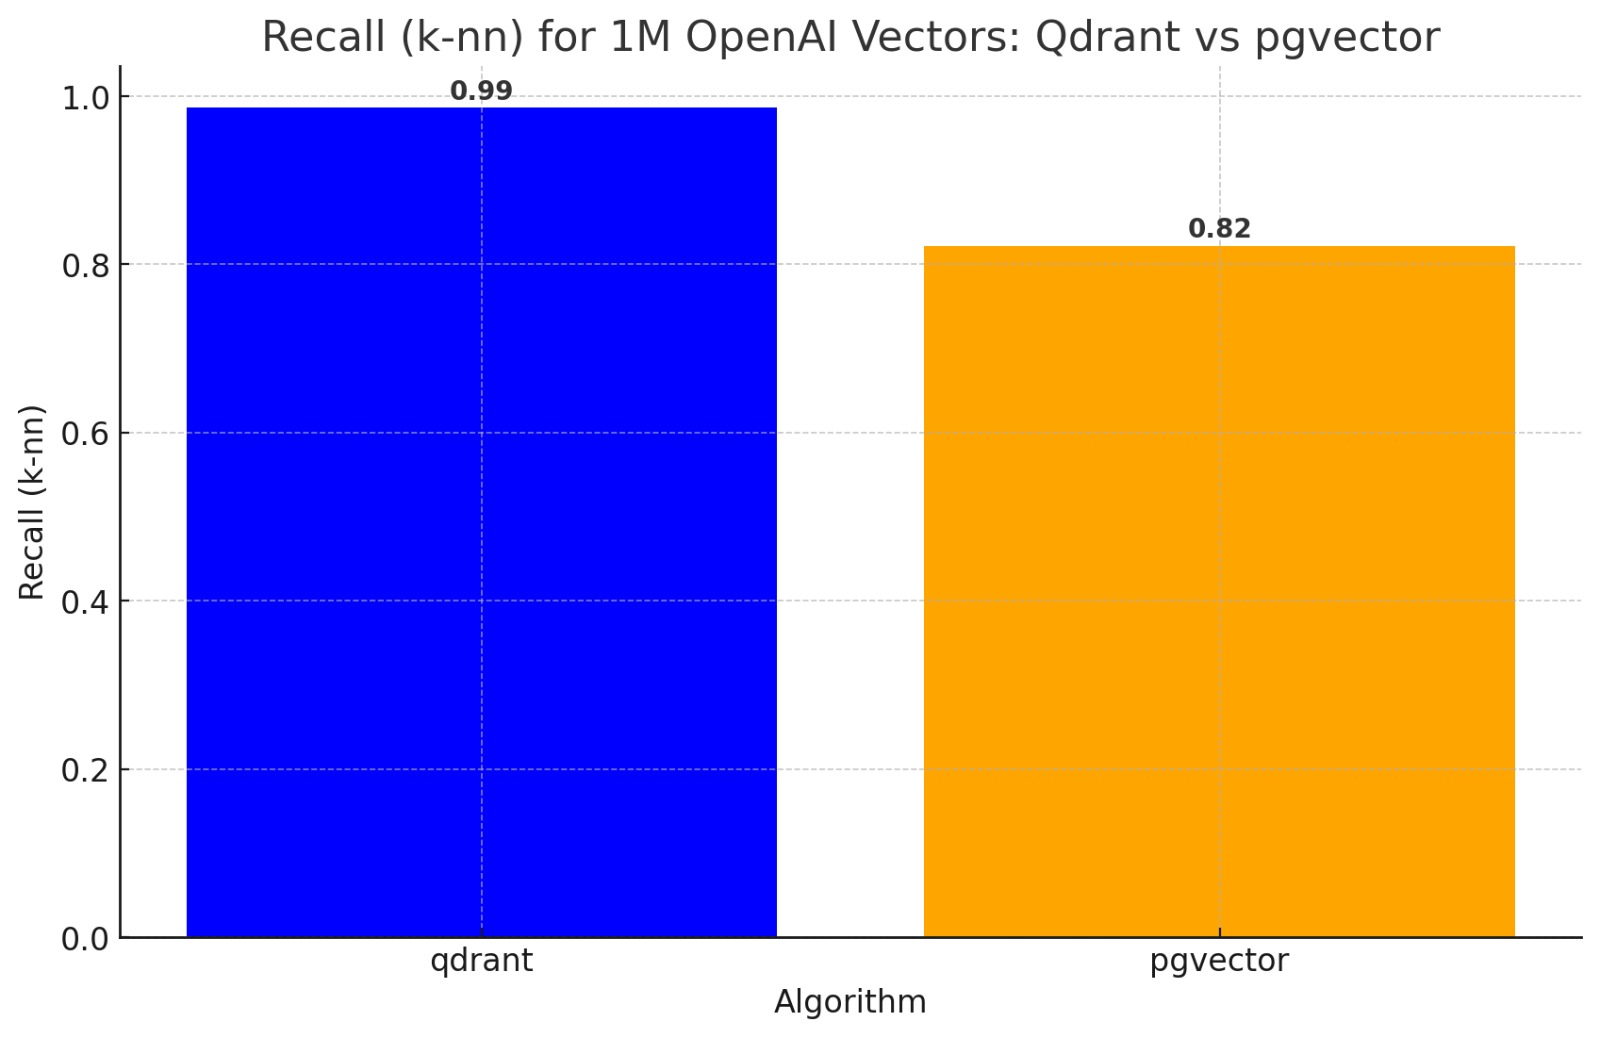
That is a 1500% deficit in speed. However, we shouldn't only consider speed as the main metric when evaluating a database. In terms of accuracy, pgvector delivers way fewer relevant results than Qdrant.

Workload

Interestingly, these disparities start to surface with as few as 100,000 chunked documents.

As an ardent supporter of PostgreSQL, it is disheartening to witness that pgvector doesn't just commence at under half the QPS at 100,000 vectors, when compared to Qdrant - it plunges precipitously beyond that.

Correctness

One might try to rationalize this by assuming that Postgres is slower, but more accurate? Data reveals that pgvector is not just slower, but also ~18% less accurate!

We measure this using the same methodology as the ann-benchmarks codebase: k-NN bruteforce as ground truth.

Latency

Here, Qdrant holds its own. The worst p95 latency for Qdrant is 2.85s, a stark contrast to pgvector, whose best p95 latency is a full 4.02s. Even more astonishing, pgvector's worst p95 latency skyrockets to an unbelievable 45.46s.

Benchmark Specs

The machine we used to run the benchmark: t3.2xlarge, 8 vCPU, 32GB RAM

For data enthusiasts among us, this Google Sheet details all the numbers for a more in-depth analysis: Google Sheet

Configuration

We use the default configuration for Qdrant and much better parameters for pgvector:

Qdrant(quantization=False, m=16, ef_construct=128, grpc=True, hnsw_ef=None, rescore=True)
PGVector(lists=200, probes=2)

The pgvector recommendation which'd be possibly worse performance-wise:

PGVector(lists=1000, probes=1)

There is much more to be tested. We will continue to explore the configuration space for both platforms and update this.

Conversations with the Community

Paul Copplestone (CEO, Supabase) has also shared his thoughts on the matter:

Yup: 1. Wait 6 months, a lot of development is happening on pgvector 2. Use hybrid search 3. Use filters on other indexed columns 4. Use partitions

And as always, take benchmarks with a grain of salt, they are never as clear-cut as they seem. We’ll publish benchmarks soon too using the latest version of pgvector

Adding my notes here:

pgvector uses full-scan when there are filters or hybrid search. This is a very slow algorithm when using 1536 embeddings. It's O(n) where n -> number of vectors matching the filter.

When there are no filters, pgvector uses IVF. This is a slower algorithm when using 1536 embeddings, and it’s less accurate than Qdrant's HNSW.

Aside: Feel free to check out my Twitter Intro to IVFPQ.

@jobergum, creator of Vespa.ai (a vector search engine) also shared his thoughts:

pgvector is an extension which default will just search the closest cluster to the query vector which for most high dimensional embedding models will return just 2-3 out of 10 real neighbors.

This is a very important point. pgvector is not a vector search engine. It's a vector extension for PostgreSQL, and that involves some tradeoffs which are sometimes not obvious.

There is a US$2000 bounty for anyone who can raise a PR to make the pgvector extension use HNSW instead of IVF.

Acknowledgements

The engineering and dataset were both done by Kumar Shivendu. Most of my contribution was in the form of spotting the bottlenecks, feedback and sponsorship.

These surprising revelations are courtesy of Erik Bernhardsson's ann-benchmarks code.

ML Model Monitoring

Mayank asked on Twitter:

Some ideas/papers/tools on monitoring models in production. A use case would be say a classification task over large inputs. I want to visualise how are the predicted values or even confidence scores vary over time? (paraphrased)

Quick Hacks

pandas-profiling

If you are logging confidence scores, you can begin there. The quickest hack is to visualize with pandas-profiling: https://github.com/pandas-profiling/pandas-profiling/

Rolling means

Calculate rolling aggregates (e.g. mean, variance) of your confidence scores. pandas inbuilt. Quite quick. Add them to your set of monitoring and alerting product metrics.

A better version of this would be to do it on cohort level. Actually, doing all the following analysis on cohort level makes sense.

Confidence Scores and Thresholds

One of the most common mistakes is to use static threshold(s) on a confidence score(s).

If you hear someone saying that they do not use thresholds for a classification problem. Stop and think. They are using a threshold, usually 0.5 from within the ML library that you are using.

This is sub-optimal. The better option would be to use a holdout validation set and determine the threshold from that.

Tagging Data

It is obvious that you will tag the predictions for which the model is least confident -- so that the model can learn.

What you should also do is this:

  • Find out samples which have high confidence and tag them first, this is a form of negative sample mining

  • For multi-class classification: Figure out samples which did not clear your threshold, and the prediction is correct. Add these back to your new training+validation set

  • Tag samples which are too close to the threshold. This will help you understand your model and dataset's margin of separation better

Training-Serving

The most common causes of trouble in production ML models is training-serving skews or differences.

The differences can be on 3 levels: Data, Features, Predictions

Data Differences

Data differences can be of several types, the most frequest are these: Schema change - someone dropped a column!, Class Distribution Change - When did this 10% training class have 20% predictions, or Data Input Drift - users have started typing instead of copy-pasting!

Schema skew (from Google's ML Guide)

Training and serving input data do not conform to the same schema. The format of the serving data changes while your model continues to train on old data.

Solution? Use the same schema to validate training and serving data. Ensure you separately check for statistics not checked by your schema, such as the fraction of missing values

Class Distribution check with Great Expectations

Training and serving input data should conform to the same class frequency distribution. Confirm this. If not, update the model by training with updated class frequency distribution.

For monitoring these first two, check out: https://github.com/great-expectations/great_expectations

For understanding data drift, you need to visualize data itself. This is too data-domain specific (e.g. text, audio, image). And more often than not, it is just as better to visualize features or vectors.

Feature Viz for Monitoring

Almost all models for high dimensional data (images or text) vectorize data. I am using features and vectorized embedding as loosely synonymous here.

Let's take text as an example:

Class Level with umap

Use any dimensionality reduction like PCA or umap (https://github.com/lmcinnes/umap) for your feature space. Notice that these are on class level.

umap-tweet-plots

Plot similar plots for both training and test, and see if they have similar distributions.

Prediction Viz for Monitoring

Here you can get lazy, but I'd still recommend that you build data-domain specific explainers

Sample Level with LIME

Consider this for text:

lime-viz

Check out other black box ML explainers: https://lilianweng.github.io/lil-log/2017/08/01/how-to-explain-the-prediction-of-a-machine-learning-model.html by the amazing @lilianweng

Class Level

You can aggregate your predictions across multiple samples on a class level:

agg-lime-viz

Training Data Checks

Expanding on @aerinykim's tweet

Robustness

Adding in-domain noise or perturbations should not change the model training and inference both.

Citations and Resources

[1] Machine Learning Testing in Production: https://developers.google.com/machine-learning/testing-debugging/pipeline/production

[2] Recommended by DJ Patil as "Spot On, Excellent": http://www.unofficialgoogledatascience.com/2016/10/practical-advice-for-analysis-of-large.html

[3] Practical NLP by Ameisen: https://bit.ly/nlp-insight. The images for umap, LIME, and aggregated LIME are all from nlp-insight

[4] Machine Learning:The High-Interest Credit Card of Technical Debt: https://storage.googleapis.com/pub-tools-public-publication-data/pdf/43146.pdf